Reports · sales controlling · attribution

Your numbers — updated every day.

Revenue per setter · close rate per campaign · show rate by weekday · cost per meeting · a revenue forecast based on your pipeline. A live dashboard, no Excel exports.

🔒 app.am-crm.com/controlling
A real view of AM CRM: Reports · sales controlling · attribution
9:41
5G
AM CRM on mobile: Reports · sales controlling · attribution
Live dashboards

Team, person and period.

Switch between the whole-team view and a single person in one click. Period filters: today, week, month, quarter, year or a custom range. Every figure live — no cache, no delay.

  • Whole team · one person · a custom group
  • Today · week · month · quarter · year · custom
  • Compared with the previous period (±%)
  • Set targets, with a progress bar
  • Arrange the widgets how you like
  • Bookmark the views you use most
Sales KPIs

Every number that matters.

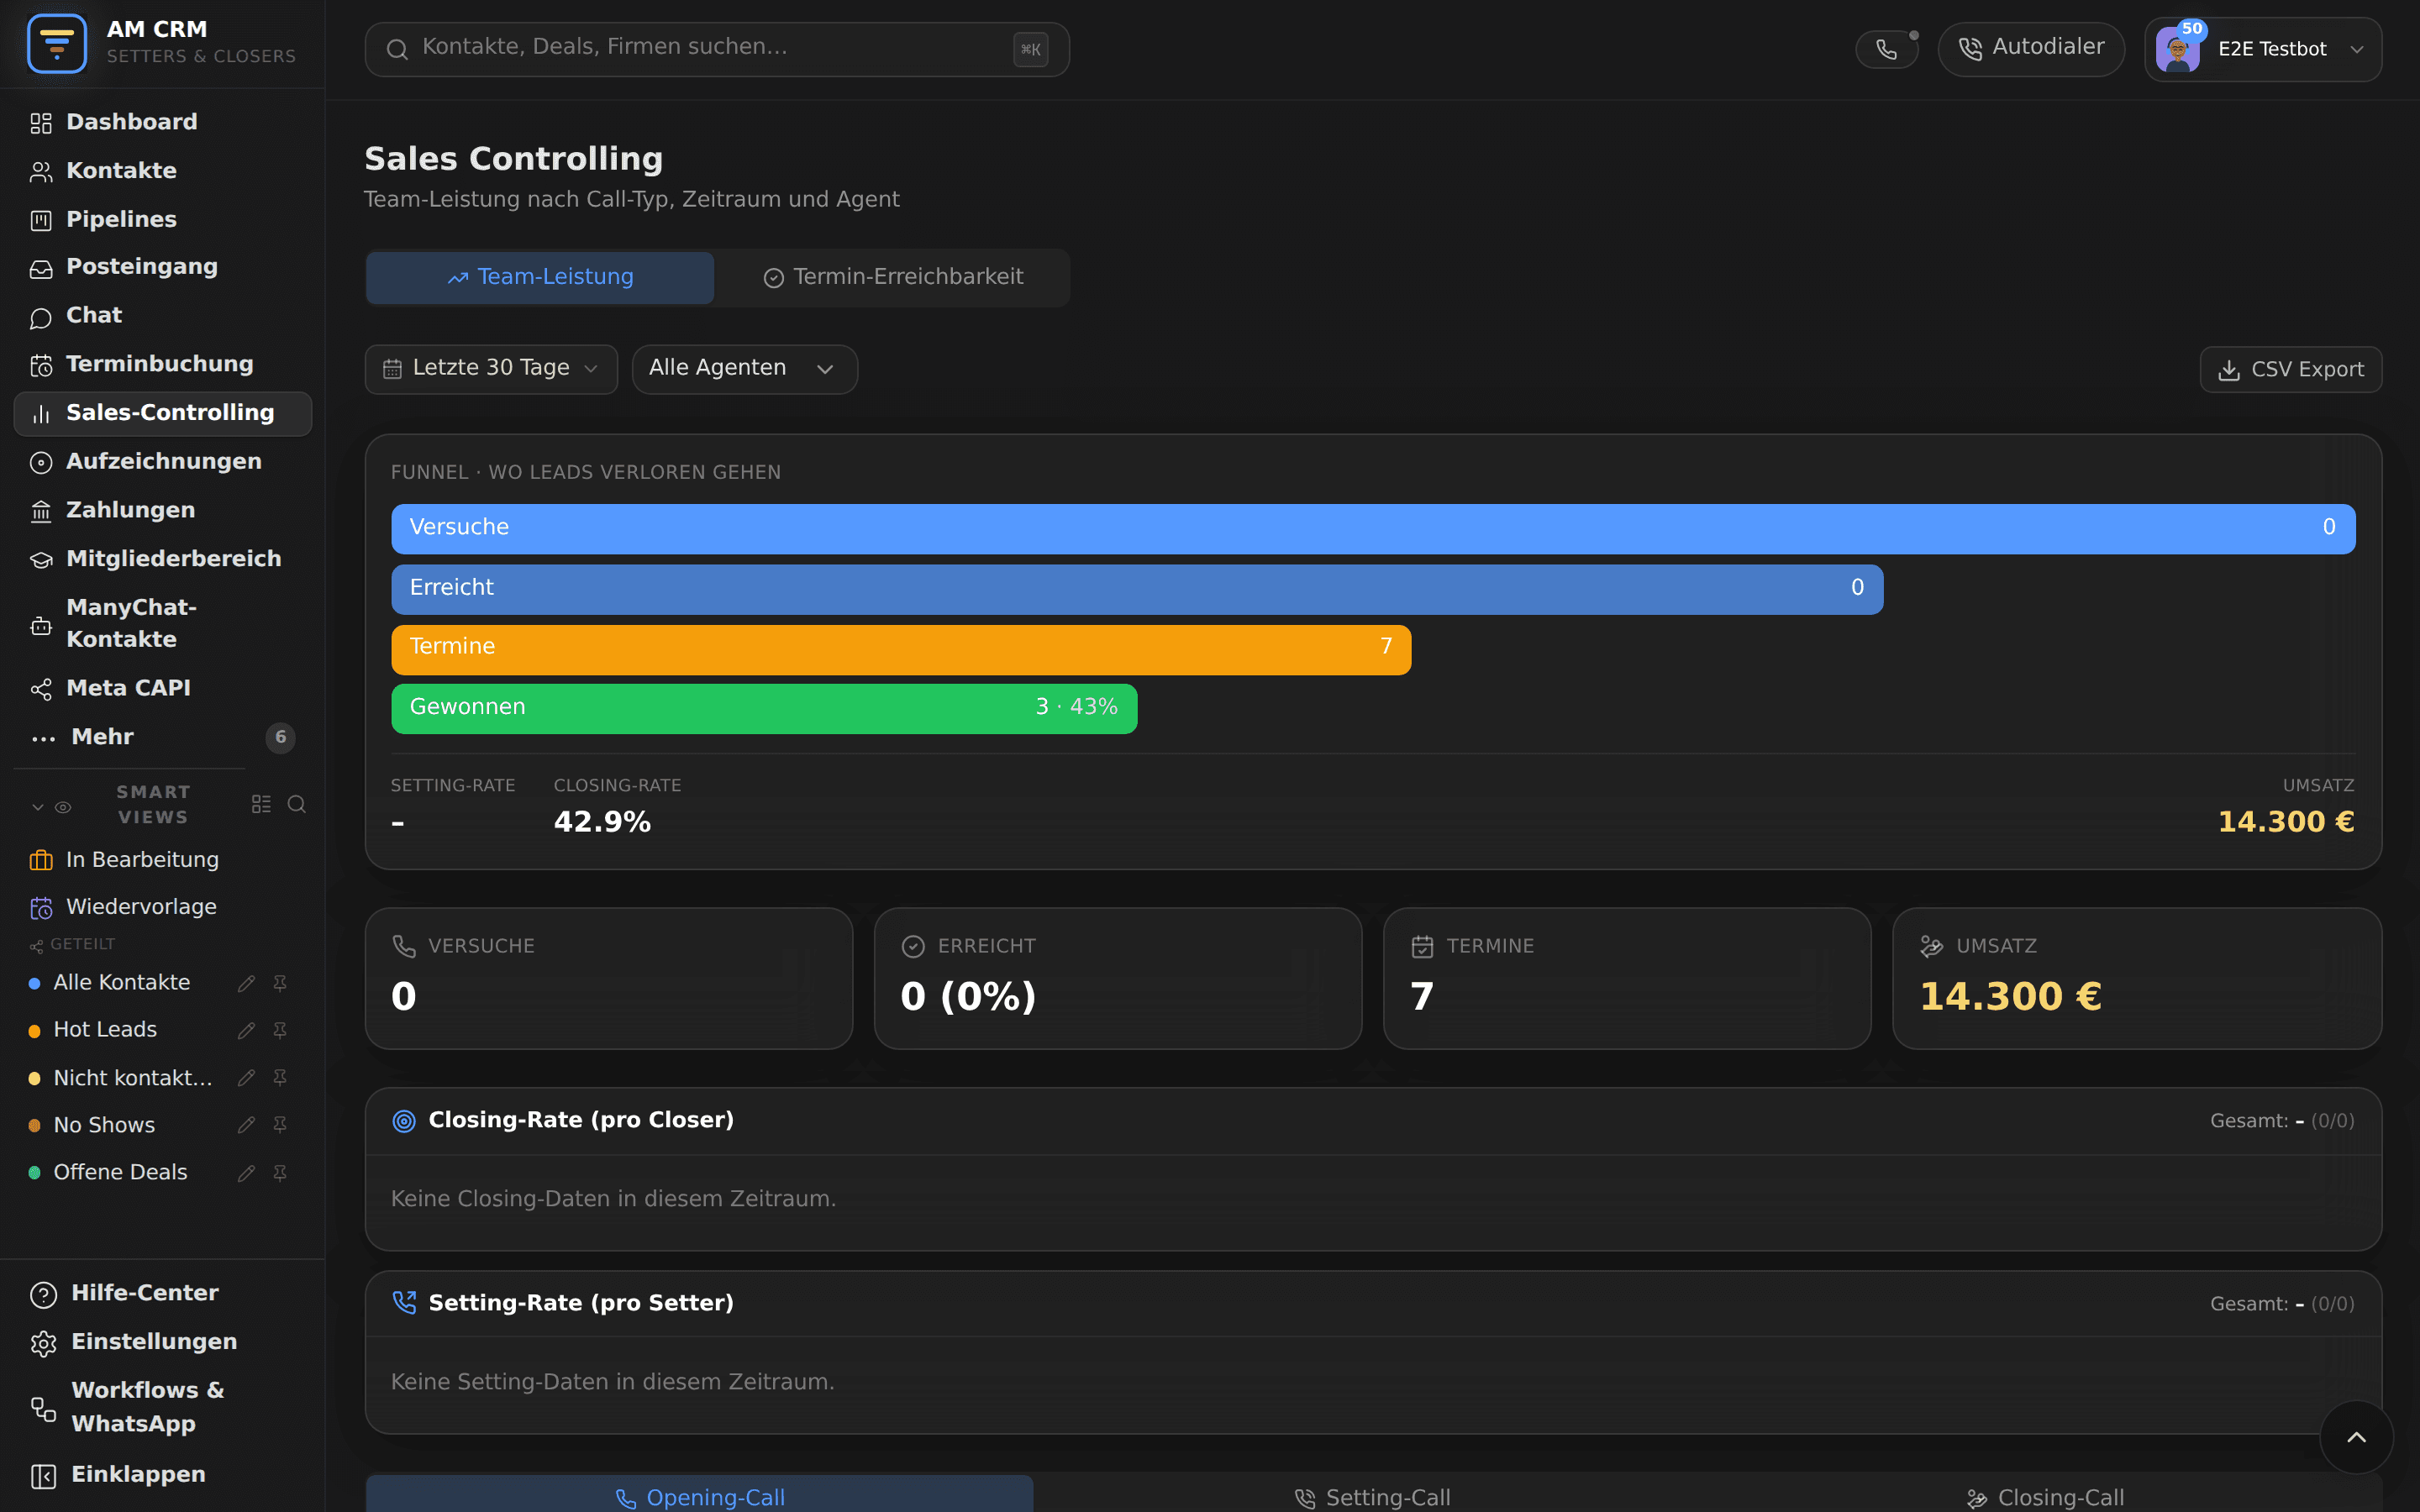
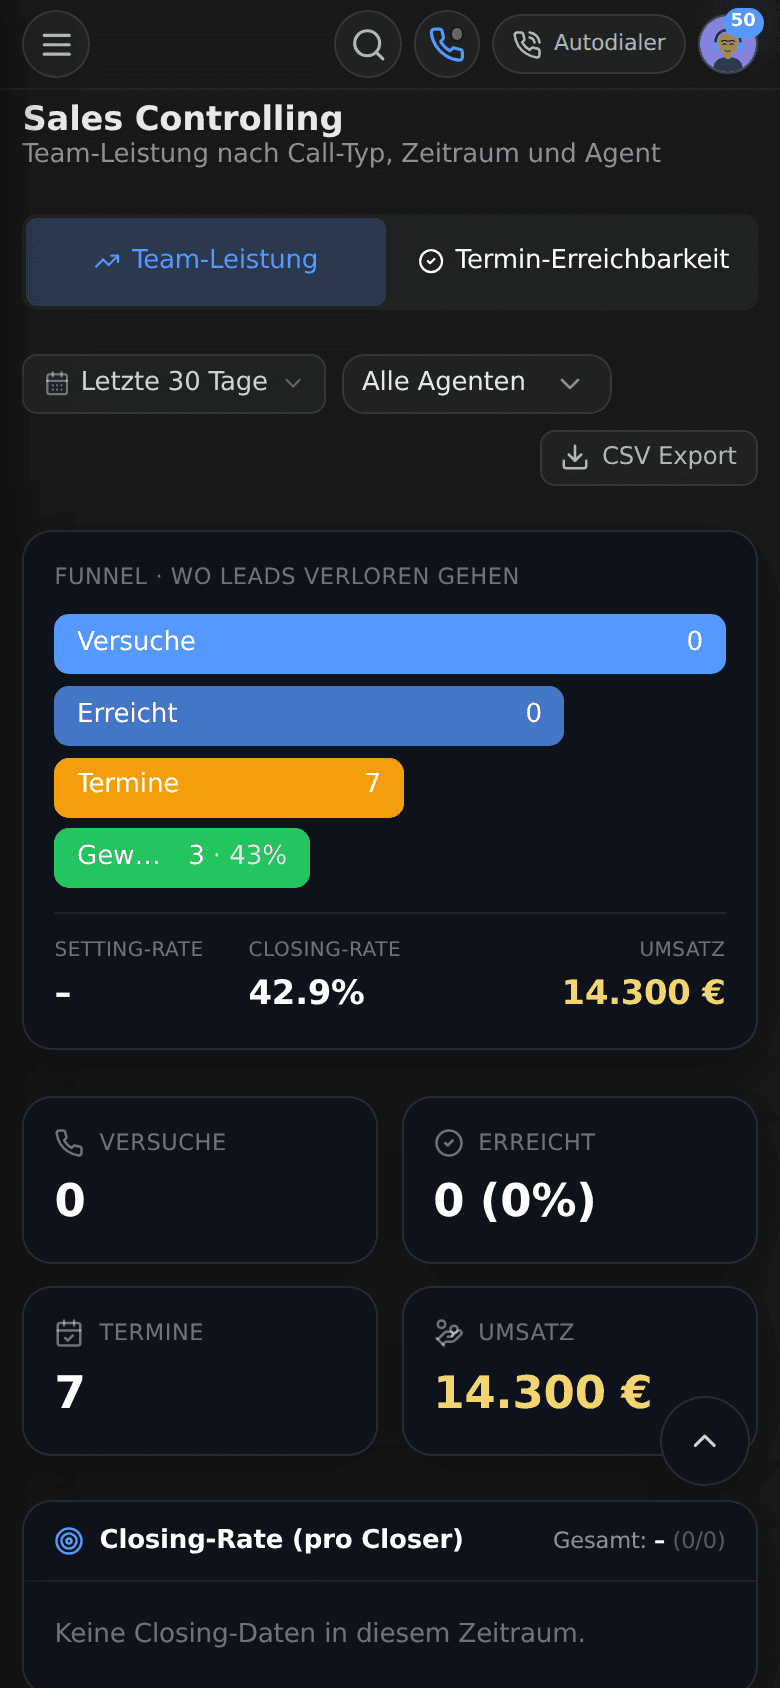
Revenue · cash collected · deals won and lost · close rate · show rate · calls per day · talk minutes · meetings booked · meetings held · cost per meeting (for Meta and Google campaigns). Calculated live, with no aggregation delay.
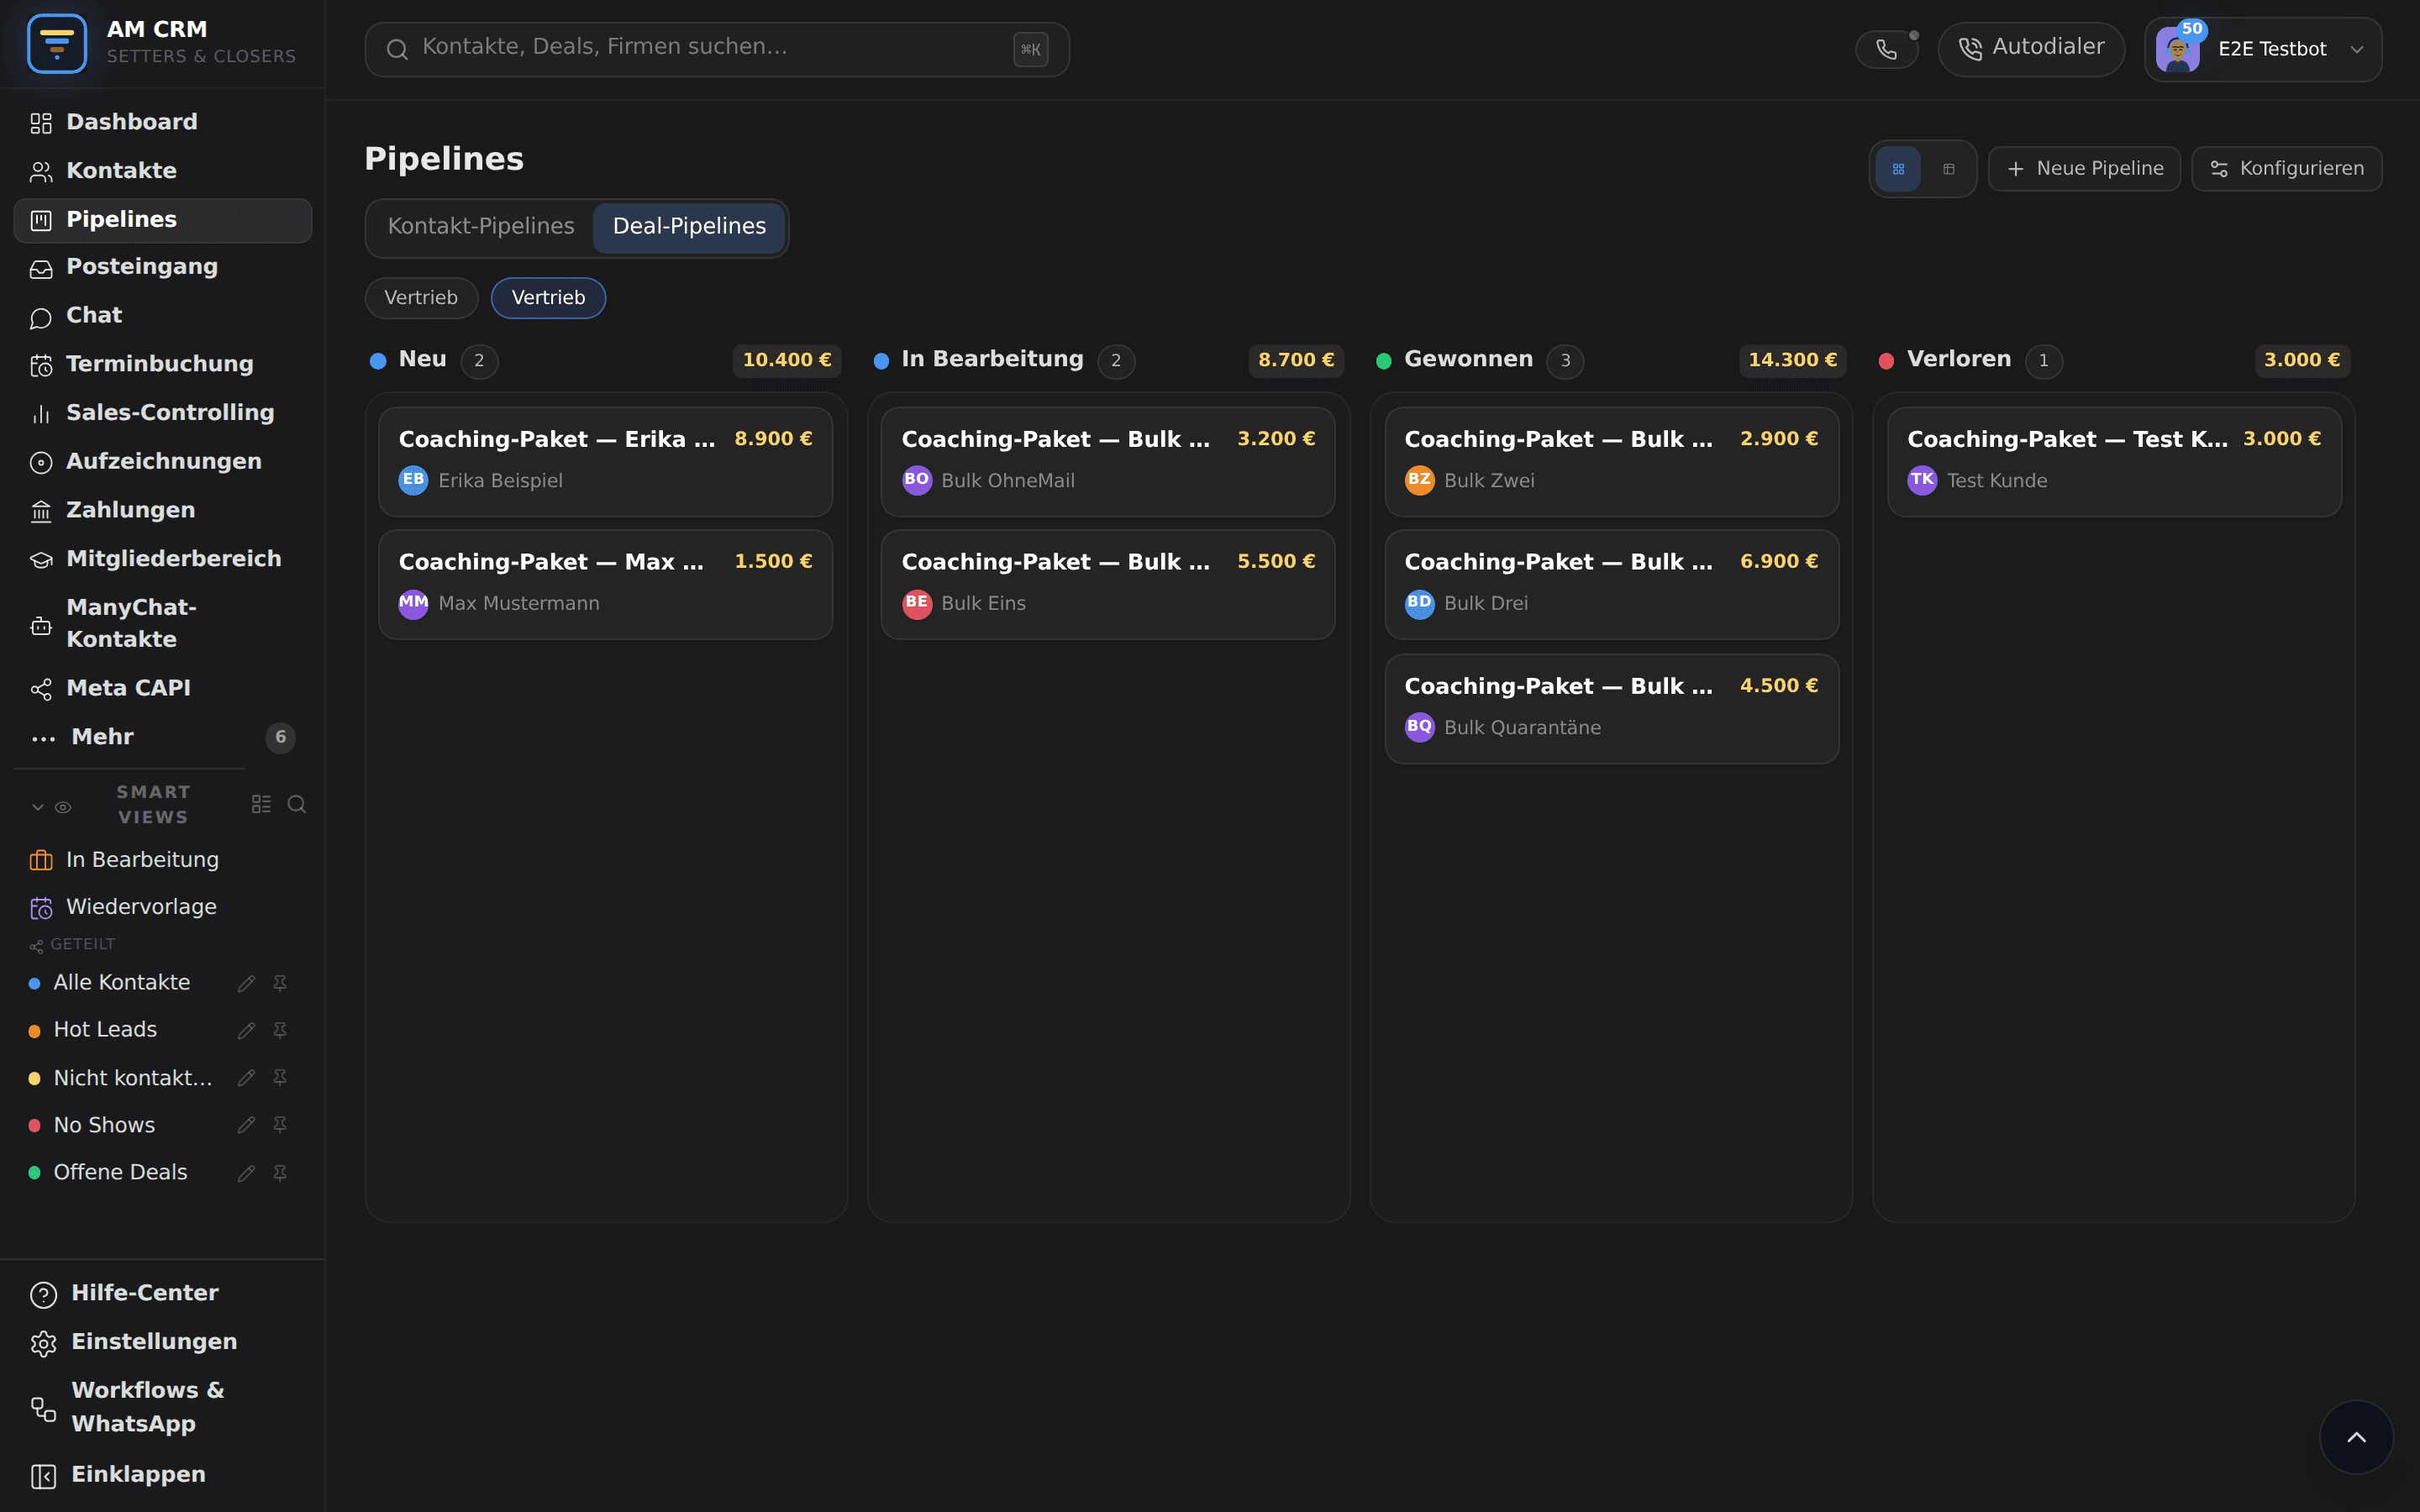
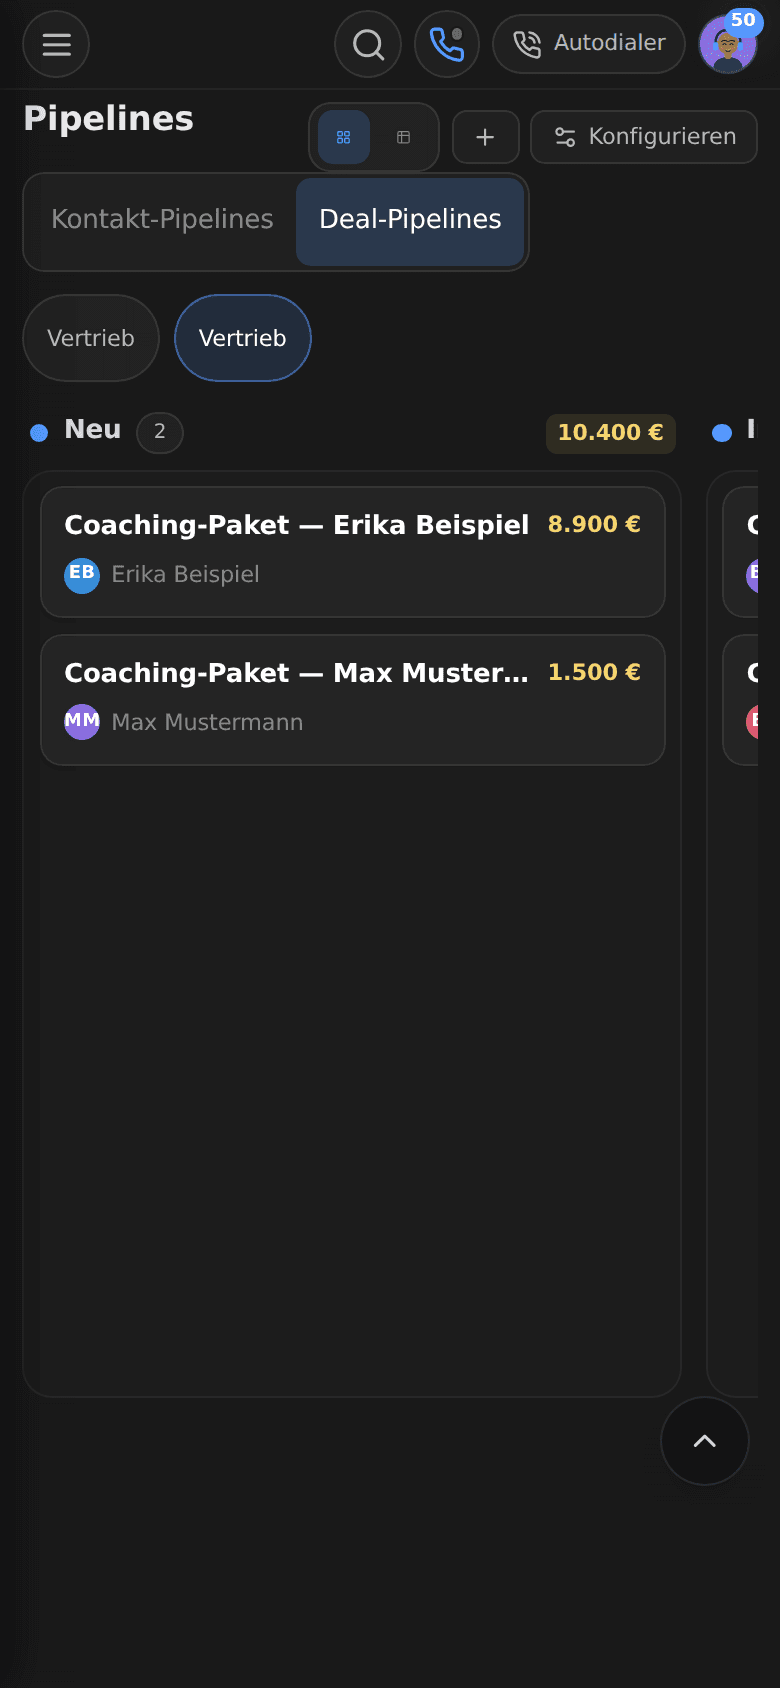
  • Revenue / cash collected
  • Close rate / show rate
  • Calls / minutes / meetings
  • CAC · LTV · ROAS (when ads are connected)
  • Sequence metrics (bounces, reply rate)
  • Ranked per team member
🔒 app.am-crm.com/pipelines
A real AM CRM view: Every number that matters.
9:41
5G
AM CRM on mobile: Every number that matters.
Campaign attribution

Which ads actually bring in revenue?

Tie UTM parameters to deal revenue. See it straight away: Meta ad set X brought in €12,400, Google campaign Y only €2,100. Move budget to what actually works — not clicks, but real revenue.

  • UTM tracking per deal
  • Meta / Google / TikTok attribution
  • First touch, last touch and multi-touch
  • Budget against revenue against ROAS
  • Cohort analysis (customers by campaign)
  • An automatic report to whoever runs the ads
🔒 app.am-crm.com/tasks
9:41
5G
Forecast

Where will the month land?

From your pipeline and your historical close rates, AM CRM works out a forecast for month end. It tells you: "carry on like this and you land at €42k — €8k above target." And it warns you automatically when you are behind.

  • A revenue forecast from the pipeline
  • Weighted by your historical close rate
  • The likelihood of hitting the target
  • A warning when you drift off target
  • A forecast per person
  • CSV export for board reports
Export + API

The numbers wherever you need them.

CSV export for Excel and Google Sheets. A direct Google Sheets sync that updates itself. A public API for your BI tool. Image export of charts for Slack and email reports.
  • CSV export, any time
  • A live Google Sheets sync
  • A REST API for BI tools
  • PNG export of charts
  • Automatic Slack reports
  • Scheduled email reports

Ready for more closed deals?

14 days free, no credit card, up and running in 15 minutes. If you do not like it, simply do not carry on.